I love taking certification exams…don’t you? It’s always fun to test your knowledge and see if you’ve been digging deep enough into the products on a daily basis to really understand them .
As referenced in the introduction part of the video, there was already another study guide out there with many solid reference links which can be found at aka.ms/SC-200StudyGuide.
Here are the slides to use for studying which contain all of the links provided and discussed in the video.
NOTE: Justin Henderson delivers some INCREDIBLE training on SIEM Tactical Analysis through SANS. This article is based on some points I learned during that course.
One of the things I’ve become very interested in lately is the MITRE ATT&CK Framework, which can be found at https://attack.mitre.org. The great thing about this tool is that it provides a real world, standardized method for understanding how adversaries attack specific platform types, including the tactics and techniques they typically leverage, the methods used by specific threat groups and so on.
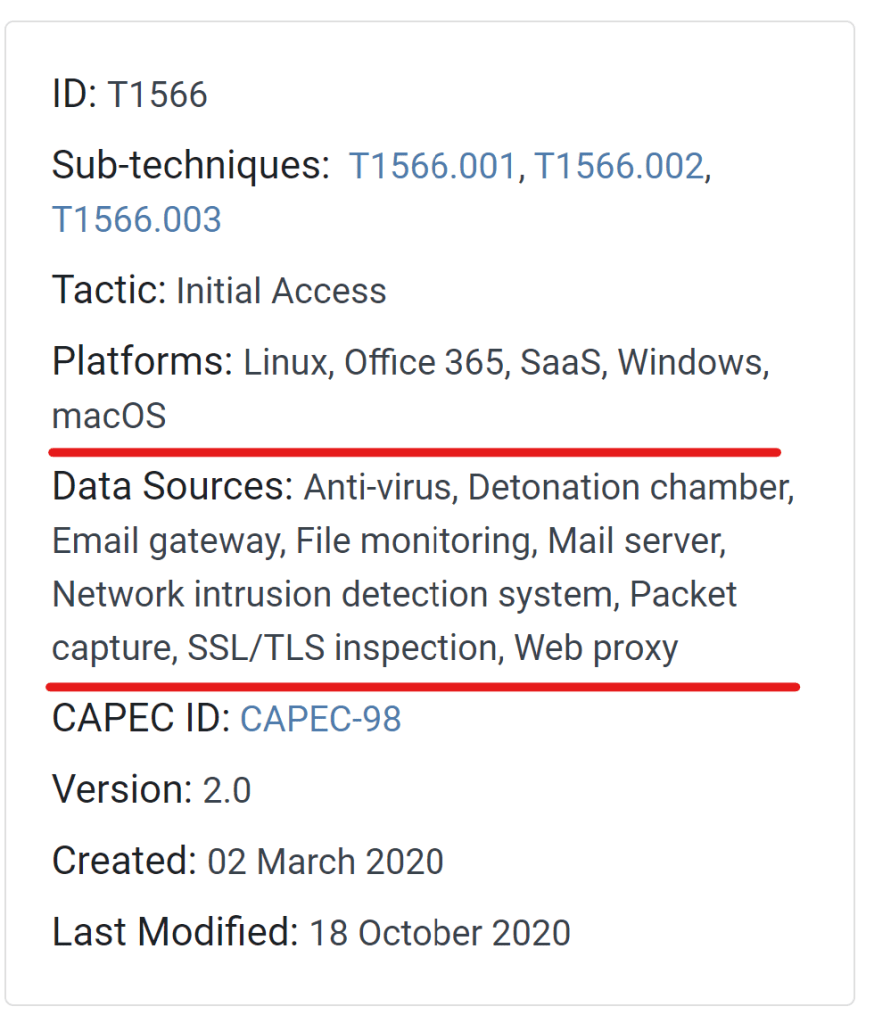
This is valuable information for understanding the threat landscape and for understanding the way that attackers think. ATT&CK also gives you information about the data sources where you would typically need to look for indicators of compromise related to the types of attacks being carried out. For example, in the screenshot below, you can see that the indicators of compromise (IoC’s) for the “Phishing for Information” technique might be found in logs on your email gateway, your network intrusion detection system, or a packet capture (among other data sources).
This is really good information for understanding what data sources might be useful to look through during an incident, but it leaves one important question unanswered for SOC analysts: am I pulling the right logs into my SIEM (such as Azure Sentinel) in order to detect an adversary that is using a specific tactic?
Using DeTTECT
This is where a tool like DeTTECT, in conjunction with ATT&CK, comes into play.
DeTTECT is an open-source tool, located on GitHub (https://github.com/rabobank-cdc/DeTTECT). Its intent is to help SOC teams compare the quality of their data logging sources to the MITRE ATT&CK matrices in such a way that they can easily see if they have the proper logging coverage to allow them to detect adversaries, based upon the tactics they may be using. What makes DeTTECT so valuable is that it does this in a way that is easily understandable since it is very visual. This can help you understand where you can shore up your organization’s logging for specific types of threats that you may be facing. For example, in the screenshot above, maybe you’re logging traffic on your web proxy, but you aren’t capturing any logging on your email gateway. You could be missing a very valuable source of intelligence in your threat detection by not ingesting those logs into Azure Sentinel. DeTTECT can help you analyze your logging and find those weaknesses. Let’s see how.
The DeTTECT framework uses a Python tool, YAML administration files, the DeTTECT editor and several scoring tables to help you score your environment. The following steps were performed on a Ubuntu VM with the DeTTECT image running inside a Docker container. The instructions for setting up a container running DeTTECT are listed here:
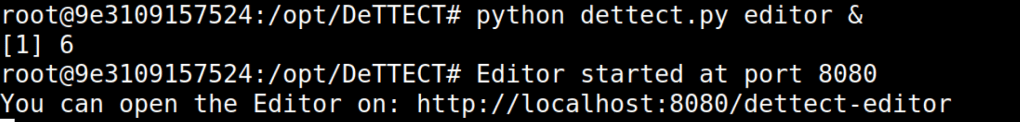
As you see in the following screenshot, I’ve started up the DeTTECT Editor running in the container.
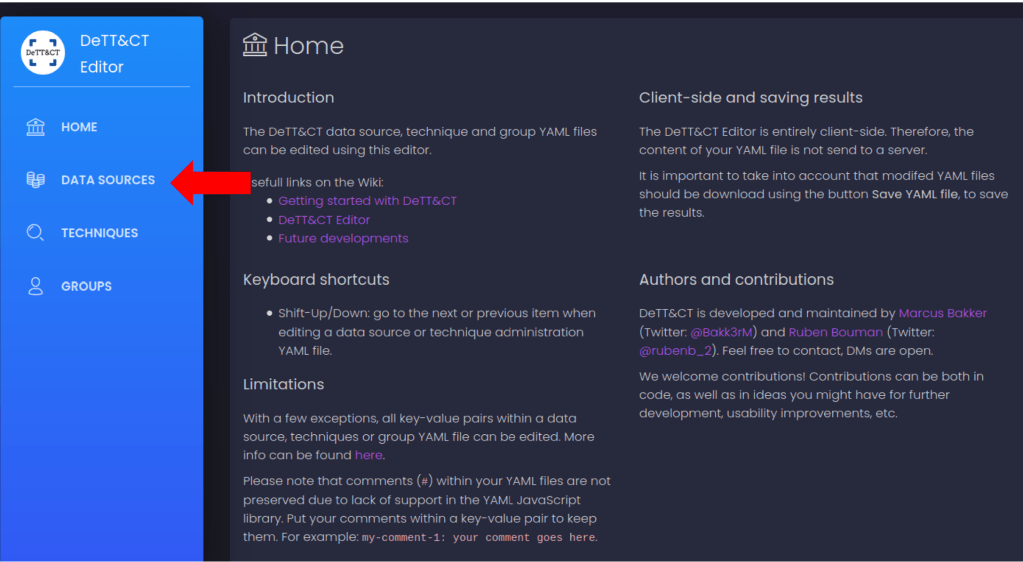
As the last line shows, I can now open the DeTTECT Editor in a URL and begin interacting with the editor. After I bring up the web page, my first step is to add Data Sources. This allows me to define for DeTTECT the logs I am capturing and ingesting into Azure Sentinel so that I can qualitatively measure the visibility I have across my logging sources.
Click on “New File”.
In this case, I want to tell DeTTECT how I’m capturing logs for Windows endpoints, so I click on “Add data source”.
Next, I define the data source as Windows event logs. Notice that the tool provides options for you to choose from as you type. For example, you could select AWS CloudTrail logs, Azure activity logs, Office 365 audit logs and numerous other sources. These options correspond to the logging sources referenced in the MITRE ATT&CK matrices, as we saw earlier.
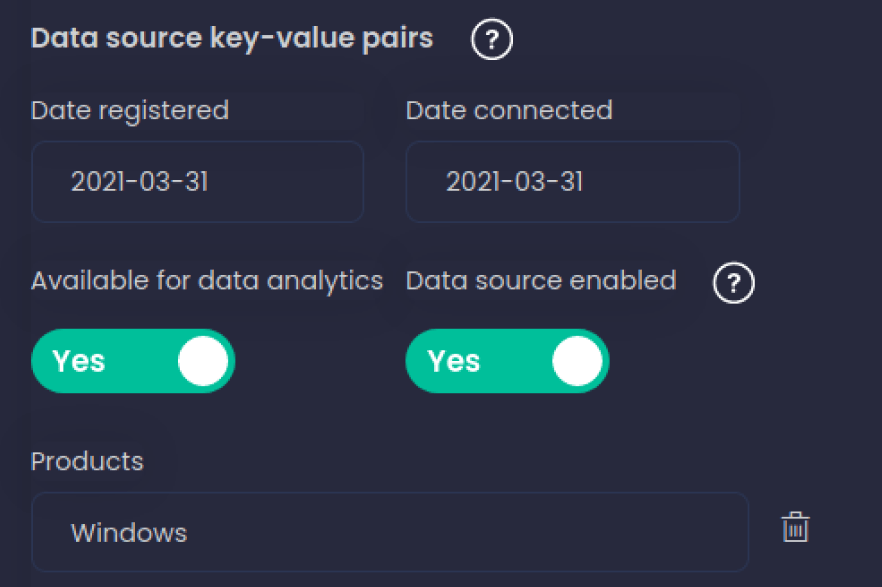
I add the date the data source was registered and connected, define whether it is available for data analytics and whether it’s been enabled.
Know Thy Data!
Now comes the part where you must know your data. In the next section, I am defining the quality of the data that I’m getting from my Windows event logging configuration. For example, maybe I’m only capturing Windows System logs (reducing my overall visibility). In my example, I’m going to assume that I’m regularly logging data using Sysmon on all my devices, and I ingest it into Azure Sentinel on a regular basis. This gives me great visibility due to the completeness of the data that Sysmon can generate (that’s going to be another blog). I move the bars accordingly.
I go through the same process for all of my data sources, and I end up with something like what you see below.
In a production environment, the list would (hopefully) be much longer, assuming you have more than just a couple logging sources. Note that the quality and coverage of the logging is going to vary according to the system or tool you are evaluating. You may get lots of detailed information from one type of networking device, while another gives fairly limited logging information. Make sure that you reflect that difference in the data sources you add.
Once you’ve added all the data sources for your environment, click on “Save YAML file”.
File Conversion
The next step involves converting the YAML file into JSON, so it can be used in the ATT&CK Navigator tool. Back in the terminal window on my Ubuntu VM, I convert the YAML file into JSON.
The result is shown below:
Layering DeTTECT Data over the ATT&CK Matrix
Now comes the fun part – seeing how your organization’s data logging sources match up to the ATT&CK Framework. This will give you a visual indicator of how much coverage and visibility you potentially have into different techniques and tactics used by adversaries.
We will be layering our data_sources_example_1.json file (created in the previous section) on top of the MITRE ATT&CK Navigator. First, let’s browse to the MITRE ATT&CK Navigator, located here: https://mitre-attack.github.io/attack-navigator/
I click on Open Existing Layer – – > Upload from Local, and then I browse to the location where I’ve stored my data_sources_example_1.json file.
And *whammo! * – look at the visualization I get!
What Does This Tell Me?
So how do I use this? Think of this as a heat map for logging coverage. The darkest purple boxes reflect the attack techniques that your organization would have the greatest visibility into, based on the quality of the logs you’re ingesting into Sentinel. The lighter the box, the less visibility your organization would have into an attacker using that technique, based on the current logging strategy.
This can be a great way to illustrate to management where you have gaps in your security logging, as it is very easy to understand the color-coding.
More importantly, perhaps, it gives you a starting point for developing a strategy for improving logging capabilities in your organization. As an example, I could look at this and immediately see that my fictional Contoso organization may have a significant amount of exposure, based on the fact that Initial Access – – > Supply Chain Compromise has no logging coverage at all.
Therefore, I may want to increase my logging in that area of the environment. On the other hand, maybe that’s not an area where Contoso feels they have much of a vulnerability (although I think recent security events should lead Contoso to rethink that position!).
In reality, we are always going to have parts of our environment where the logging is healthy and robust, and we will also have areas where the logging isn’t quite what we would like it to be.
By using a tool like DeTTECT in conjunction with the ATT&CK Navigator, you can begin to prioritize where to increase your logging and continue to improve the security of your organization.
For a couple months now, our partners and customers have been attempting to read the direction that Microsoft is taking with regard to Microsoft Teams and Skype for Business. I think it’s safe to say there’s been some confusion and *ahem*…. “gaps” in the guidance.
For example, the partners I’ve been working with have asked questions like:
“Is Microsoft Teams a replacement for Skype for Business?”
“How do I integrate Microsoft Teams into my Skype for Business infrastructure?”
“Are there best practices for how to configure my Teams and Channels?”
“How will Teams integrate with my existing audio/video systems?”
“Is there a certification program for Teams devices like there was for Skype for Business headsets, phones, etc…?”
These are especially important questions for partners because they have to (1.) be able to talk about how this will work with their own customers and (2.) they have to be able to deliver on those engagements.
Well, as of today, the clouds of confusion are beginning to part on many of these questions.
Now you might be saying, “That’s all well and good, David, but that’s just the technical considerations. I have people asking questions about the future of Skype, the licensing implications of moving to Teams from Skype for Business, and cloud video interop with Microsoft Teams. What am I supposed to tell them?”
Trust me, those questions have been on the minds of many partners and customers, and there is now some public guidance on these questions in the form of an FAQ, located here:
Clearly, there are still many more questions that partners and customers will have as we roll out more features and capabilities for Microsoft Teams, so we’ll keep answering those questions and creating articles to help guide you along on this journey.
For now, there’s lots to digest, and lots to use as you work with your customers in planning and deploying Microsoft Teams.