NOTE: Justin Henderson delivers some INCREDIBLE training on SIEM tactical Analysis through SANS. This article is based on some points I learned during that course.
SIEM Training | SIEM with Tactical Analysis | SANS SEC555
As with any SIEM, when it comes to ingesting networking, system or service logs into Azure Sentinel, you have to do more than simply send a large quantity of logs to Sentinel. Pushing gigabytes, terabytes or even petabytes of data into Sentinel creates two challenges:
- it creates a lot of potential noise for threat hunters to sift through, and
- storing all that data in Log Analytics can get very expensive, very quickly.
The key then, is to ingest quality logs – logs that will give you the information you need for threat hunting and that will be useful in identifying indicators of compromise. The question we need to address is – how can we do that effectively? There are several excellent strategies for ingesting useful logs from network devices, Linux systems and cloud services, but in this article, I’m only going to address the challenge of logging “interesting” Windows events and sending them to your SIEM.
You Can’t Log Everything
Okay, let’s get something out of the way right now.
If a vendor tells you that their log collection tool or strategy captures ALL the events in Windows, they are…ummm…”stretching the boundaries of believability”. Here’s why.
A given Windows 10 machine, contrary to many people’s expectations, is not an infinitely scalable resource, with no constraints on its processing power or storage capacity. As a result, there are built-in boundaries set on what it can, or is allowed to do. As one simple example, you can’t connect 100 monitors to your laptop and get them all to work.
Those same types of constraints exist for things like event logging. If you go into your Event Viewer tool in Windows 10 and start expanding all the different types of logs, you’ll see that there are more than your standard “System”, “Security” and “Application” logs. For example, on my laptop, I have literally HUNDREDS of things being logged in addition to the 3 major event logs.

Obviously not all of them are logging the same amount of data, but there’s still a lot of logging going on.
So, if you are trying to pull ALL of those logs from a Windows machine, it would require the machine to open up hundreds of individual channels to accommodate all the logs – and that just isn’t going to happen. You will hit your maximum number of 255 channels, and then Windows will politely tell you to take a flying leap…. or Windows may take its own flying leap for you.
So, if we can’t capture ALL the logs in Windows – and we probably don’t need to anyway – how do we capture the stuff that’s important when it comes to threat hunting?
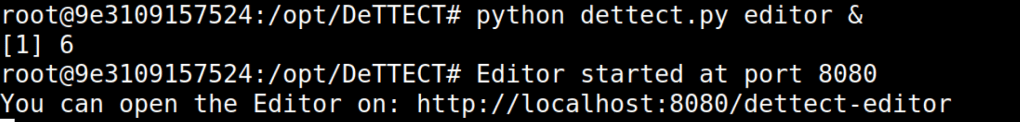
Enter Sysmon…
Sysmon is a free tool, originally developed by the amazing Mark Russinovich and Thomas Garnier, for the Sysinternals suite. You can download sysmon here:
What makes Sysmon so valuable for threat hunters is that, in contrast to your standard Windows logging in Event Viewer, Sysmon was specifically designed to log activity that is typically associated with abnormal or threat activity. That includes things like:
- Process creation and access
- Tracking of network connections
- Registry additions or modifications
- Drivers and DLL loading
- WMI monitoring
- Modification of file creation times
- File hashes
…And lots of other similar data.
What’s cool is that Sysmon also generates its own set of event logs and you can configure exactly what gets captured in those logs! Let’s take a look…
Logging Before Sysmon
In the example below, I’ll show you what gets logged on a machine without Sysmon.
Let’s take an example that is a fairly common vector for compromise – an attacker using remote WMI to launch a process on a victim’s machine.
In the screenshot, I’m attacking the machine named VICTIM1721, and the user account is named VICTIM. (I mean really…with a name like that, he was asking for it.) The basic idea is that I run the command below to launch the calculator executable on the victim’s machine.

And as we see from the calculator executable on the VICTIM1721 machine, I was successful.

How very exciting. I can run calculator on the victim machine. What a coup for my team.
Obviously, launching calculator in a visible manner on the victim’s machine isn’t terribly useful for me as an attacker, but it’s illustrating the point that I could launch ANYTHING I WANT on the victim’s machine using WMI if I’ve got the right access. And if I was an attacker, I wouldn’t be launching calculator, and I definitely wouldn’t be launching anything visibly.
As an example, here I’m using WMI to enumerate the groups on my VICTIM machine. That’s information that is VERY interesting to me as an attacker.
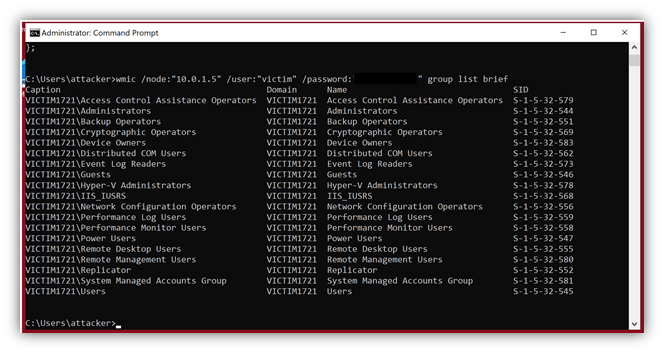
So, the question is, what kind of information is provided by Windows for this type of event?
If we look at the Windows Security event logs on the VICTIM1721 machine, we see event ID’s 4624 and 4688, as you see below. There’s some useful information there, such as the fact that a process was created, the time and date of its creation and the fact that it was initiated by NETWORK SERVICE.
Event ID 4624
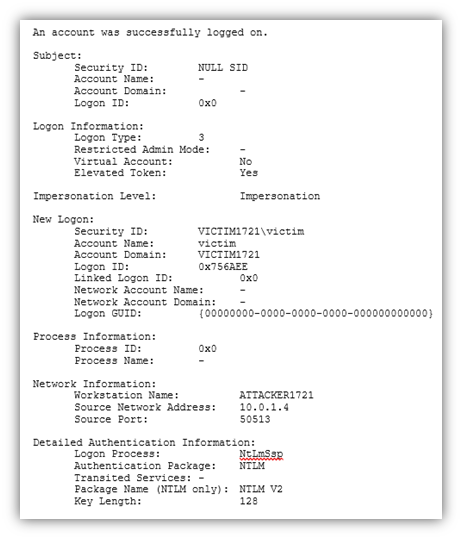
Event ID 4688

This is reasonably useful information, but there are two problems:
- the information is contained in two separate events, and
- there is other information that could help me identify this as anything more than a harmless process being created.
For example, as an attacker, I might choose to launch my malware as a process named svchost.exe. That would rarely even be noticed on a single machine because there’s usually a dozen or more instances of svchost.exe running on a machine at any given time. It would be hard to pick one of them out as being malicious without having some additional context. Additionally, if I look at the “New Process ID” and “Creator Process ID” lines, I see 0x1fe8 and 0xfa4, which isn’t readily usable.
As an aside, during my testing, my machine was being actively attacked externally, as you can see in this event entry. The attacker at IP address 103.119.92.112 tried a number of usernames and passwords against my VICTIM machine, even though it was only publicly accessible for about 4 minutes.
What a world.

Anyway, moving on….
Sysmon-ify Your Logging!
Now let’s add sysmon to the picture. On my VICTIM machine, I’ve downloaded sysmon and installed it according to the default install parameters. That gives me some decent logging capabilities, but I want to enhance the logging. There are a couple great GitHub projects where people have developed comprehensive sysmon configuration files that you can use to customize your logging.
A couple custom logging configs that I like are:
https://github.com/SwiftOnSecurity/sysmon-config
https://github.com/olafhartong/sysmon-modular
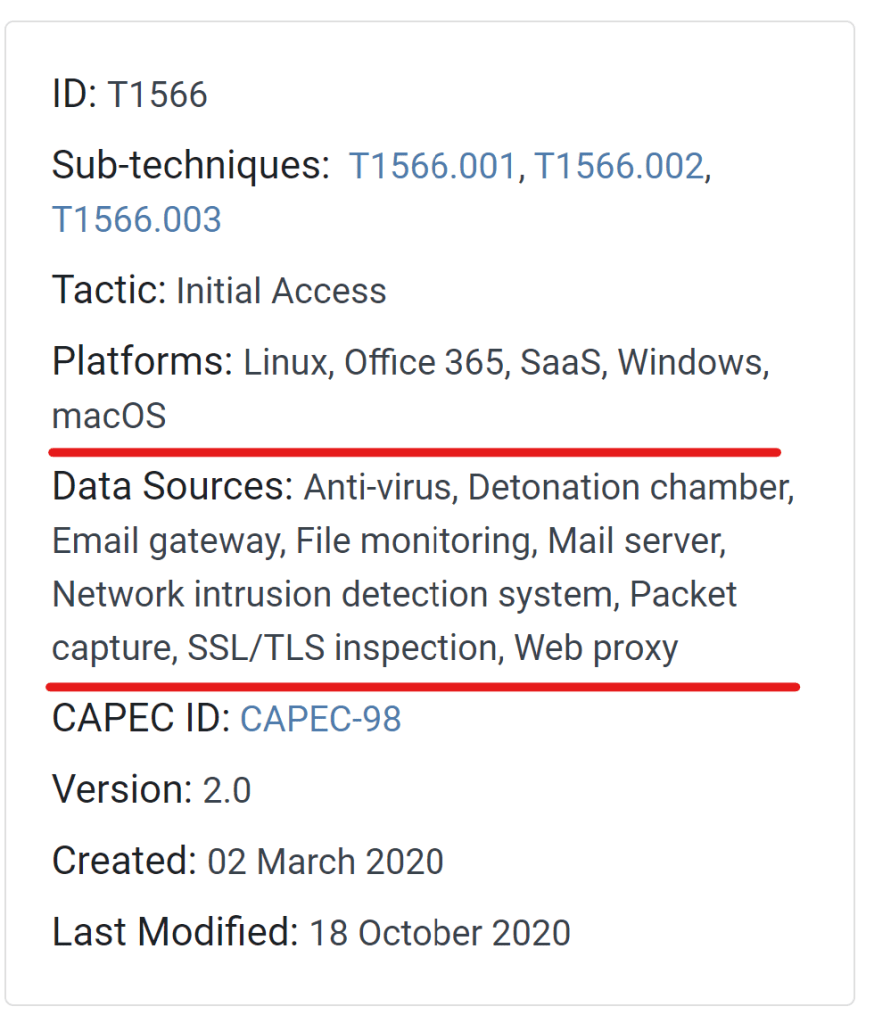
What’s very useful about these config files is that they were built with the express intent of logging the actions of known threat actors. They accomplish this by aligning the logging capabilities with the MITRE ATT&CK Framework, in that they look for specific TTP’s (Techniques. Tactics and Procedures) identified in that framework. In the screenshot below, we see a logging configuration defined that is intended to identify actions consistent with T1037 and T1484 from the ATT&CK Framework.
https://attack.mitre.org/techniques/T1037/002/
https://attack.mitre.org/techniques/T1484/

In the repository, there are .XML files that you can download and apply to your own machines to enhance the logging on those machines and dump useful events into the sysmon event logs.
Simply download the XML and run this command (if it’s the first time you’re configuring sysmon):
sysmon.exe -accepteula -i sysmonconfig.xml
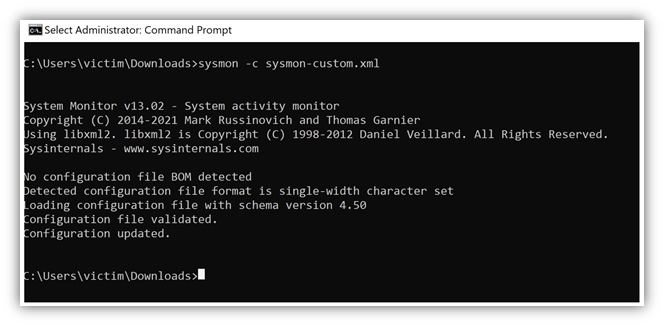
If you already have a configuration file for sysmon and want to update that file, run this command:
sysmon.exe -c sysmonconfig.xmlAs you see below, I updated the sysmon configuration file on my VICTIM1721 machine.
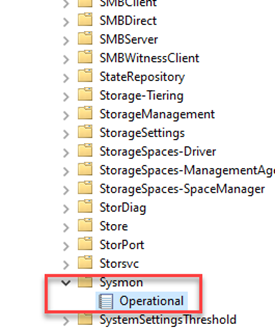
Once sysmon is installed and starts logging actions, you can find the event log by opening Event Viewer and going to:
Applications and Services Logs – -> Microsoft – – >Sysmon
The Operational Log is where you’ll find the relevant logging for sysmon.

Now if we run the same type of remote WMI command against my VICTIM machine, I can go to my sysmon event logging and see what shows up. In this case, I see something like this in the event:

Notice that the information shown in this event is a little easier to sort through.
- Time is shown in UTC format – always a valuable data point when investigating issues and trying to correlate events across multiple devices.
- The Process ID and Parent Process ID are in a human-readable format (8168 and 4004). This will make it a little bit easier to identify the process on the affected machine.
- Information is provided about the file version of calc.exe and associated hash so I can tell if a file has been modified from its original state.
Additionally, it’s all in a very structured format, which means I can create rules in my SIEM to parse data very easily out of the event.
Now, I can start pulling sysmon information from that Operational log into the SIEM and use that for triggering alerts and incidents.
To be clear, the sysmon Operational log isn’t intended to REPLACE specific logs you may be pulling from machines, such as the security logs or system logs. Those logs still have a value and may capture information not found in sysmon entries.
However, because sysmon was designed to help identify and point a flashlight at anomalies and unexpected behaviors, it can help you to be more efficient in your logging, reduce the overall number of log sources you pull off each machine and help your security team more quickly identify issues that impact the security of your network.
Check out sysmon today!